My Way of Learning QlikView
Published:
Learning-by-doing is of course a great form of learning, especially for practical skills.
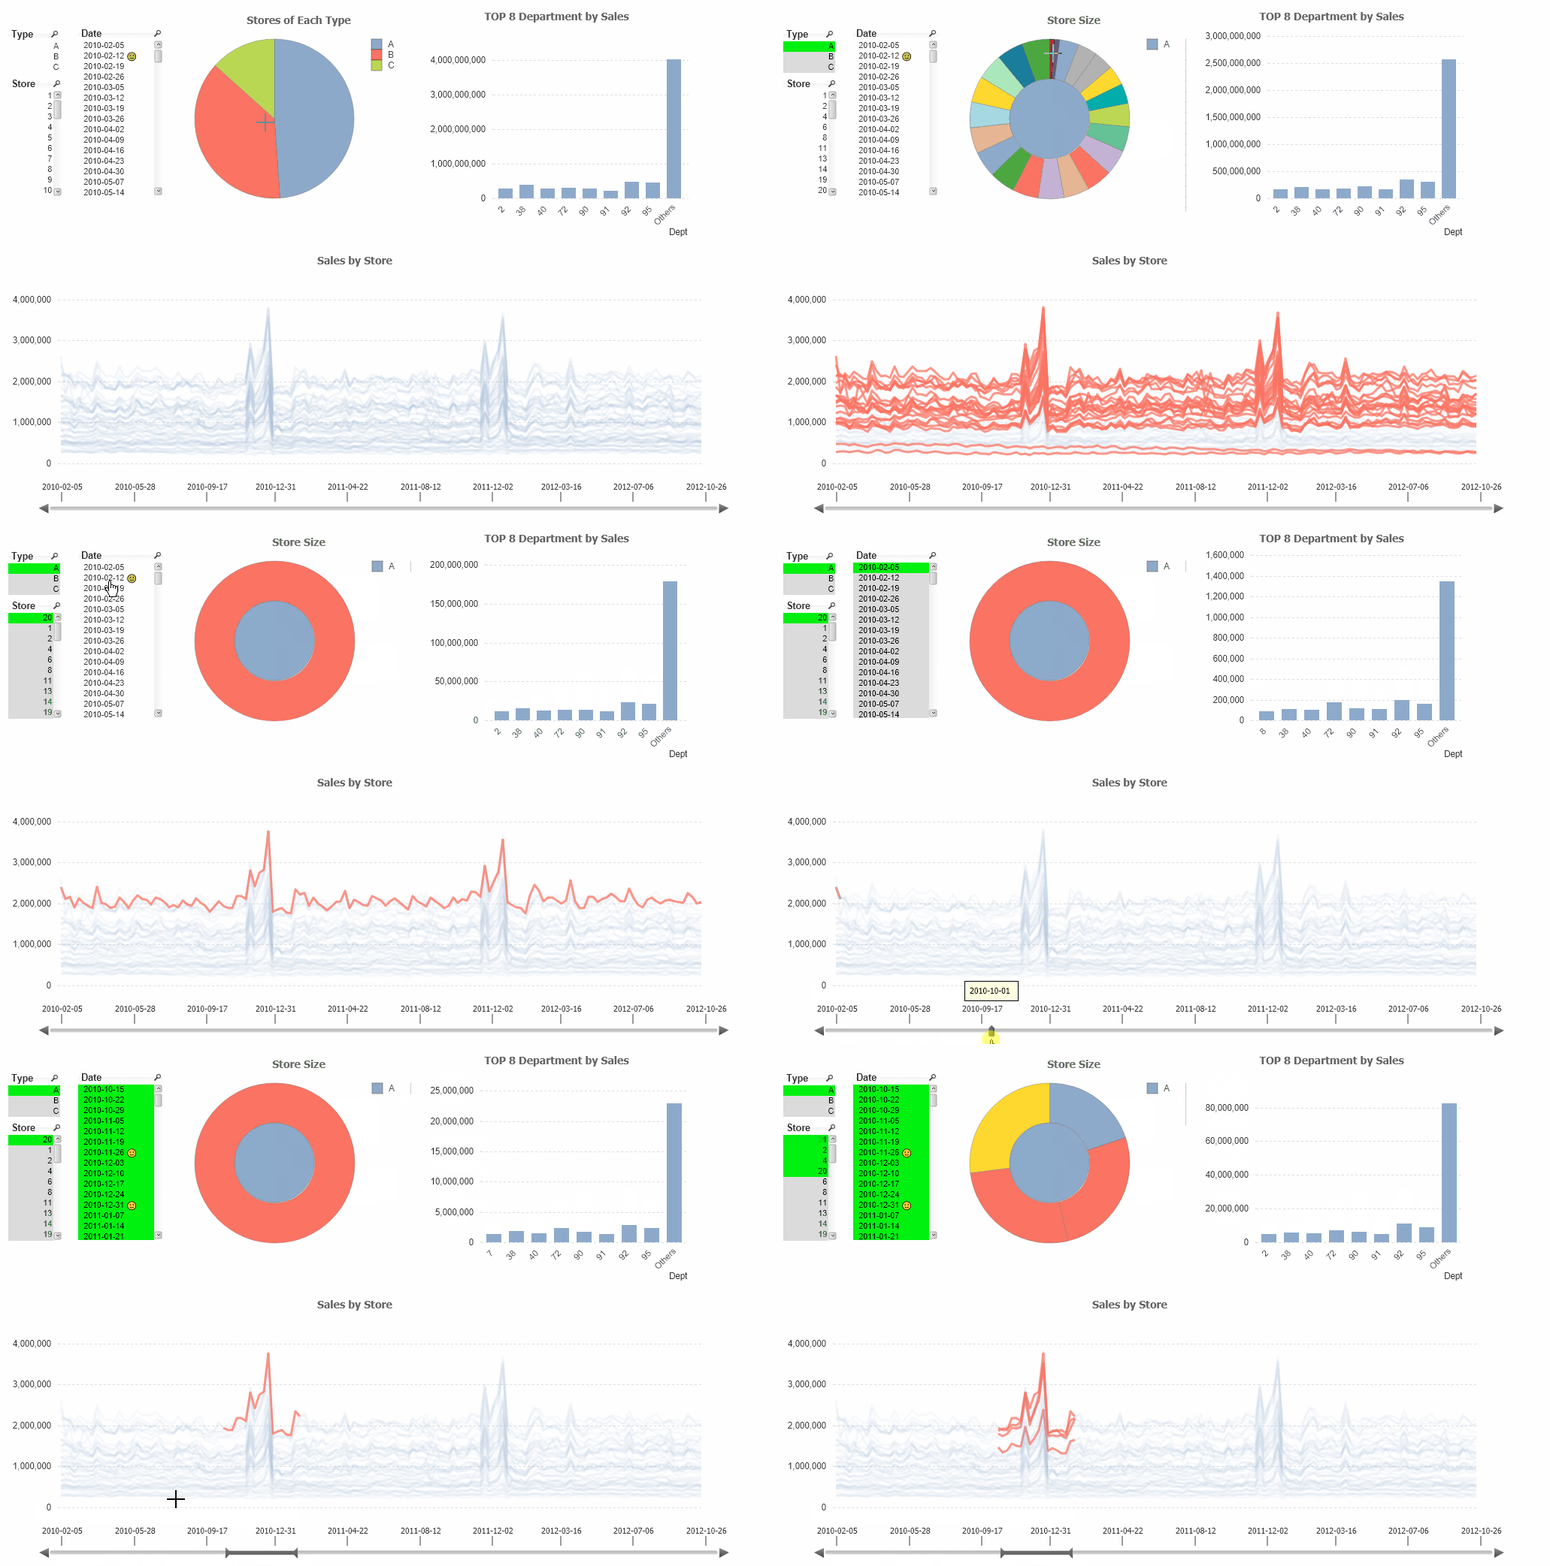
In order to learn QlikView, I started by making a dashboard myself, exploring as many features in QlikView as I can: I wrote codes for chart titles, chart colors, expressions; I tried to use the object of slider for date/time by aligning it to date axis of the line chart (this object is not commonly used in dashboards, however, I think in this way, it increases the effectiveness of date selection.

But, later I was told by an expert in this field that being able to make a user-friendly dashboard is not enough, and biulding a data model is equally important and time-consuming. Immediately I start off on this topic, by reading the help-file of QlikView, where there is a whole section of "Introduction to loading data", followed by reading a number of blog posters written by Qlik people.
After several days of effort, I ended up with a mind map of a step-by-step guide of how to build a data model from scrach, shown below.